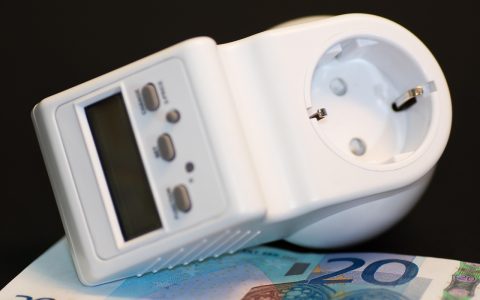
When your monthly utility bill climbs without an obvious change in weather or household habits, knowing how to audit home electricity usage US households rely on gives you immediate control over your energy costs. Rather than paying hundreds of dollars for a basic professional energy assessment, you can pinpoint costly drains using accessible tools: your electric utility dashboard and a digital plug-in power meter.
Conducting a self-directed electrical audit allows you to systematically separate continuous background consumption from variable appliance cycles. By learning how to read instantaneous power draws, log operating cycles over multi-day periods, and quantify inactive standby power, you can eliminate wasteful phantom loads and make targeted changes that meaningfully reduce your monthly bills.
Understanding Electricity Metrics: Watts, Kilowatts, and Kilowatt-Hours
Before plugging in testing hardware or analyzing utility graphs, you need to understand the basic units of measurement printed on your billing statements and appliance labels. Conflating instantaneous power with cumulative energy consumption over time is the single most common reason homeowners miscalculate operating costs.
Electrical draw is measured in three primary values:
- Watts (W): The unit of instantaneous power. This represents the rate at which an electrical device consumes energy at any given second. For example, an efficient LED bulb might draw 9 watts, an idling laptop draws 25 watts, and a portable electric space heater on high draws 1,500 watts.
- Kilowatts (kW): Equal to 1,000 watts. Heavy-draw equipment (such as central air conditioner compressors, electric water heaters, or Level 2 EV chargers) typically express continuous demand in kilowatts to keep numbers readable. A 1,500-watt space heater operates at a demand of 1.5 kW.
- Kilowatt-Hours (kWh): The metric your electric utility actually bills. A kilowatt-hour represents volume over time: one kilowatt of power drawn continuously for one full hour. If you run a 1,500-watt space heater for two hours, it consumes 3.0 kWh of energy (1.5 kW × 2 hours).
To convert an appliance’s measured wattage into real monetary cost, use this standard two-step calculation formula:
(Watts × Daily Operating Hours) ÷ 1,000 = Daily kWh Consumption
Daily kWh Consumption × Electricity Rate ($/kWh) = Daily Operating Cost
To find your actual rate, inspect the “Electric Supply” and “Energy Delivery” sections on your latest utility bill. Do not just look at the base supply charge; divide your total monthly balance (including delivery fees, distribution charges, and local taxes) by your total billed kWh. This gives your true blended cost per kilowatt-hour, which across US regions typically spans from roughly $0.11 to over $0.30 per kWh depending on your state and utility tariff structure.
Gathering Your Essential Audit Toolkit
A thorough DIY residential audit requires minimal capital investment. Most equipment can be purchased online or at local hardware stores for under thirty dollars, and many municipal libraries or utility conservation programs lend these diagnostic kits out at no charge.
Your diagnostic kit should include:
- A plug-in electricity usage monitor: Commonly known by brand names like Kill A Watt, these devices plug directly into standard 120-volt grounded (three-prong) wall outlets. You plug the target appliance into the receptacle on the face of the monitor to read instantaneous volts, amps, active watts, and accumulated kilowatt-hours over time.
- Access to your utility’s online portal: Most US electric providers offer a customer web portal showing smart meter data broken down by day, hour, or 15-minute intervals.
- An audit worksheet or spreadsheet: A dedicated log where you record the room location, appliance name, measured wattage, daily run time, and projected monthly cost.
- A basic infrared thermometer (optional): Useful for checking temperature differentials across refrigerator door gaskets or detecting hot electrical connections.
Step 1: Establishing Your Whole-Home Baseline with Smart Meter Data
Begin your audit by determining your home’s total continuous base load—the electricity your home consumes when everyone is asleep, no appliances are actively running, and the household is at rest. Smart meters make establishing this baseline simple without opening your breaker panel.
Log in to your electric utility account and navigate to the usage analytics or interval data tab. Look for your historical hourly interval data on a day when the home was unoccupied, or examine the hours between 2:00 AM and 5:00 AM. During these early morning hours, lighting is off, entertainment electronics are idle, and human activity is virtually zero.
Note the flat line of consumption during this window. If your home continuously pulls 0.8 kWh every hour throughout the night, your baseline power draw is roughly 800 watts. That continuous 800-watt load accounts for nearly 576 kWh per month before anyone turns on a stove, runs a load of laundry, or activates the HVAC system. If your overnight baseline is unexpectedly high (e.g., exceeding 500 to 700 watts for a standard single-family home), it indicates significant continuous drains—such as unmanaged dehumidifiers, continuous hot water recirculating pumps, aging secondary refrigerators, or rampant phantom power.
Step 2: The Kill A Watt Meter Guide for 120-Volt Appliances
Once you know your overall baseline, use your plug-in power monitor to evaluate individual 120-volt plug-in devices room by room. Operating a plug-in electricity monitor involves a repeatable testing protocol to ensure accurate data collection across different appliance types.
Configuring and Operating the Monitor
- Plug the monitor directly into a wall outlet without using an extension cord or surge protector.
- Plug the appliance’s power cord directly into the receptacle on the front face of the monitor.
- Press the “Watt” button to view the live, instantaneous draw while the device is in active operation.
- Press the “Volt” button to verify stable line voltage (typically fluctuating between 115V and 123V in US homes). Low voltage can cause electric motors to draw higher amperage, generating excess heat and wasting power.
- Switch the device off or place it into standby mode to observe the residual phantom draw.
Short-Term vs. Long-Term Logging Protocols
Appliances with steady, constant power draws—such as floor lamps, desktop monitors, network routers, audio amplifiers, and microwave clocks—can be measured in 30 to 60 seconds. Note the stable wattage reading and multiply by your estimated daily hours of use.
Appliances with cycling compressors, motorized fans, or heating elements cannot be accurately measured with a quick snapshot. Refrigerators, freezers, portable dehumidifiers, and space heaters must remain plugged into the monitor for a minimum of 24 to 48 hours. Press the “kWh” button on the monitor to read the total cumulative energy consumed across the entire test period, then divide by total logged hours to calculate a true average hourly draw that captures both active and idle cycles.
Targeting Phantom Load Power Consumption Room by Room
Phantom load—also referred to as vampire draw or standby power—is the electricity consumed by electronic devices while they are turned off or sitting in a low-power standby mode. In the typical American home, phantom loads account for 5% to 10% of total residential electric consumption, quietly running up bills 24 hours a day, 365 days a year.
Take your plug-in meter room by room, focusing on common standby power offenders:
| Device Category | Typical Standby Draw (Watts) | Typical Active Draw (Watts) | Audit Priority |
|---|---|---|---|
| Smart TVs & Streaming Setups | 0.5 – 15 W | 60 – 220 W | High (frequently active in standby) |
| Cable / Satellite Set-Top Boxes | 15 – 35 W | 18 – 40 W | Critical (nearly identical draw on/off) |
| Game Consoles (Instant-On Mode) | 10 – 25 W | 75 – 200 W | High |
| Desktop PC Workstations & Docks | 5 – 20 W | 100 – 450 W | Moderate |
| Microwaves & Kitchen Countertop Units | 1 – 4 W | 900 – 1,500 W | Low (negligible standby) |
| Modems, Routers & Mesh Wi-Fi Nodes | 8 – 20 W (Continuous) | 8 – 20 W | Baseline (runs 24/7/365) |
The Living Room and Media Center
Home theater setups are primary phantom load contributors. Older cable set-top boxes, subwoofers with constant auto-sensing amplifiers, soundbars, and modern game consoles configured with “instant-on” background updates continuously pull substantial wattage from the wall. Plug the entire power strip into your monitor to measure the combined standby drain of your entertainment cluster.
The Home Office
Multi-monitor setups, powered USB-C docking stations, laser printers, and desktop power supplies continue drawing power even when computers are shut down. Laser printers, in particular, cycle internal heating elements periodically while in sleep mode to keep internal fuser rollers warm, creating silent, intermittent spikes throughout the day.
Auditing Major 240-Volt and Hardwired Appliances
Standard plug-in monitors only fit 120-volt receptacles. Major household energy consumers—central air conditioners, heat pumps, electric water heaters, electric clothes dryers, and electric ranges—operate on 240-volt dedicated circuits or are hardwired directly into your main service panel. You cannot plug these into a standard 120-volt meter, but you can audit them accurately using systematic smart meter monitoring.
The Smart Meter “Step Test” Method
Most modern digital utility smart meters feature an LCD screen cycling through several diagnostic displays. One screen shows cumulative kWh (e.g., standard billing read), while another display indicates instantaneous kilowatt draw (often labeled as “kW” or identified by a flashing digital rate indicator).
To measure hardwired equipment manually:
- Walk through your home and turn off all lights, small appliances, and entertainment electronics, leaving only baseline essentials running.
- Go outside to your physical electric meter and note the current instantaneous kW reading.
- Have a second person turn on a single high-draw appliance—such as kicking on the central air conditioning via the thermostat, or starting an electric water heater recovery cycle.
- Observe the meter display update over the next 60 seconds. The increase in instantaneous kW represents the exact operational load of that appliance.
- Turn that unit off, let the meter stabilize, and repeat the process for your electric dryer, pool pump, or well pump.
If your physical meter is inaccessible, replicate this step test digitally by turning specific equipment off for dedicated 24-hour blocks and tracking the resulting drop on your utility dashboard’s hourly interval graphs.
Diagnosing Refrigeration and Cold Storage Draw
Refrigerators and standalone freezers run continuously, making them substantial line items on your monthly bill. An inefficient or failing unit can consume three to four times the energy of a properly operating model without showing external signs of failure.
To properly evaluate refrigeration equipment:
- Log a full 48-hour cycle: Refrigerators cycle on and off based on ambient temperature and door openings. A 48-hour plug-in meter test captures both active compressor cycles and automatic defrost heating cycles.
- Inspect condenser coils: Heavy dust accumulation on rear or bottom condenser coils prevents effective heat dissipation. This forces the compressor to run hotter and stay on twice as long per cycle. Measure the 24-hour kWh draw, clean the coils thoroughly using a coil brush and vacuum, and log the subsequent 24 hours. You will often see a measurable drop in daily kWh consumption.
- Check gasket integrity: Close the refrigerator door on a dollar bill. If the bill pulls out easily with no resistance, the magnetic gasket is worn, allowing ambient room moisture and heat to enter the cabin. This leads to continuous compressor operation and heavy frost buildup.
- Evaluate secondary garage refrigerators: Refrigerators operating in unconditioned spaces (like garages or covered porches) work significantly harder during hot summer months. Auditing a secondary garage fridge often reveals it consumes more power than all primary kitchen appliances combined.
Calculating High-Draw Costs to Reduce Electric Bill Appliances
Once you compile your audit worksheet, convert the raw data into actionable cost projections. Group your appliances into three distinct categories: continuous baseline loads, cyclic loads, and discretionary loads.
Here is an example breakdown demonstrating how individual components add up over a standard 30-day billing cycle (calculated at an illustrative national rate of $0.16 per kWh):
- Continuous Baseline: A 25-watt network/modem/smart-hub stack running 24/7 consumes 18 kWh per month ($2.88/mo).
- Standby Load: A media center pulling 30 watts in standby consumes 21.6 kWh per month ($3.46/mo).
- Cyclic Load: An older garage refrigerator pulling 4.5 kWh per day consumes 135 kWh per month ($21.60/mo).
- Discretionary Heating/Cooling: A 1,500-watt space heater run 8 hours daily during winter consumes 360 kWh per month ($57.60/mo).
- Hardwired Load: A 4,500-watt electric water heater running 3 hours daily consumes 405 kWh per month ($64.80/mo).
By organizing your audit results this way, you immediately identify high-impact targets. Focusing on turning off low-wattage LED lights yields modest savings, whereas tackling an unmanaged space heater, an aging secondary freezer, or extended entertainment center standby draws directly eliminates major kilowatt-hour blocks.
Common DIY Audit Mistakes to Avoid
Achieving accurate audit numbers requires avoiding several common methodological errors:
- Relying exclusively on nameplate data: The electrical rating plate stamped on the back of an appliance lists the manufacturer’s maximum theoretical wattage draw for safety compliance, not its average running draw. A microwave labeled at 1,500 watts might draw 1,800 watts during heating and only 2 watts at rest. Always measure actual draw rather than assuming nameplate numbers.
- Testing for insufficient durations: Logging a refrigerator or air conditioner for 15 minutes while the compressor is idle will give you a false reading of zero to 5 watts. Always capture full duty cycles over multiple hours.
- Ignoring seasonal baseline shifts: Don’t assume a baseline established in October applies to January or July. Sump pumps, pipe heating cables, furnace blower fans, and ventilation equipment introduce seasonal shifts in your continuous electrical floor.
- Misinterpreting power factor: Advanced plug-in monitors display “Power Factor” (PF) alongside watts and volt-amps (VA). Residential customers are billed for real power (watts), not apparent power (VA). Ensure your meter is configured to display true active watts when recording consumption.
Implementing Corrective Actions Based on Audit Findings
An electrical audit only provides value when paired with targeted remediation. Once you identify your home’s major drains, implement standard load-reduction strategies:
Eliminate Standby Waste with Smart Surge Protectors
Install Tier 2 advanced power strips (smart strips) in home offices and media consoles. These strips designate one outlet as the master (e.g., your television or PC). When the master device powers down, the strip automatically cuts physical electrical power to all auxiliary peripheral outlets (soundbars, game consoles, auxiliary monitors, subwoofers), entirely eliminating phantom standby consumption without requiring you to unplug individual cords.
Program Cyclic Loads with Heavy-Duty Timers
For appliances that must run regularly but do not need 24-hour operation—such as recirculating hot water pumps, engine block heaters, or pool pumps—install heavy-duty mechanical or digital timers. Restricting a hot water recirculating pump from running 24 hours down to 4 peak morning and evening hours cuts that appliance’s consumption by more than 80% without impacting household convenience.
Adjust Appliance Operating Temperatures
If your audit reveals heavy water heater or refrigeration draws, verify operational setpoints. Water heaters should be set to 120°F (49°C) for an optimal balance of sanitation, safety, and energy conservation. Fresh food refrigerator compartments should maintain between 37°F and 40°F, while standalone freezers should run at 0°F. Setting temperatures colder than necessary forces compressors and heating elements into longer, more frequent operating cycles.
Maintaining Long-Term Household Energy Efficiency
Understanding how to audit home electricity usage US households experience is not a one-time project. Electrical loads shift whenever you add new electronics, alter work-from-home routines, or experience mechanical wear on older equipment. Keep your plug-in power monitor accessible in a utility drawer, and perform a quick check whenever your monthly utility statement shows unexpected divergence from seasonal historical trends.
By pairing smart meter analytics with room-by-room plug monitoring, you remove guesswork from utility budgeting. With hard data in hand, you can make informed decisions about appliance replacements, correct hidden operational flaws, and keep your household electricity consumption running as leanly and reliably as possible.