
For nearly three decades, the basic financial agreement behind residential rooftop solar in the United States was straightforward: when your rooftop panels generated more electricity than your home needed, your electric utility bought that excess power back at full retail rates. A kilowatt-hour (kWh) exported at noon was worth the exact same amount as a kilowatt-hour consumed at 8:00 PM. This 1:1 valuation, known as traditional Net Energy Metering (NEM), built the economic foundation for millions of residential installations. Today, understanding the solar net metering export rate changes US utility impact is vital for any homeowner navigating shifting grid policies and energy bills.
That regulatory landscape has entered a period of rapid restructuring. Public utility commissions across the country are approving structural modifications to rate designs, introducing export credit reductions, net billing frameworks, and complex time-of-use windows. Understanding how these public policy shifts operate is essential whether you already have solar panels or are currently evaluating a residential installation.
When public utility boards lower compensation for solar electricity sent back to the grid, the economic payback period for rooftop installations changes dramatically. Homeowners can no longer rely on simplified online calculators that assume fixed 1:1 net metering credits for the next 25 years. Navigating this modern policy environment requires a clear understanding of export mechanisms, utility billing statements, grandfathering terms, and the growing financial role of home battery storage.
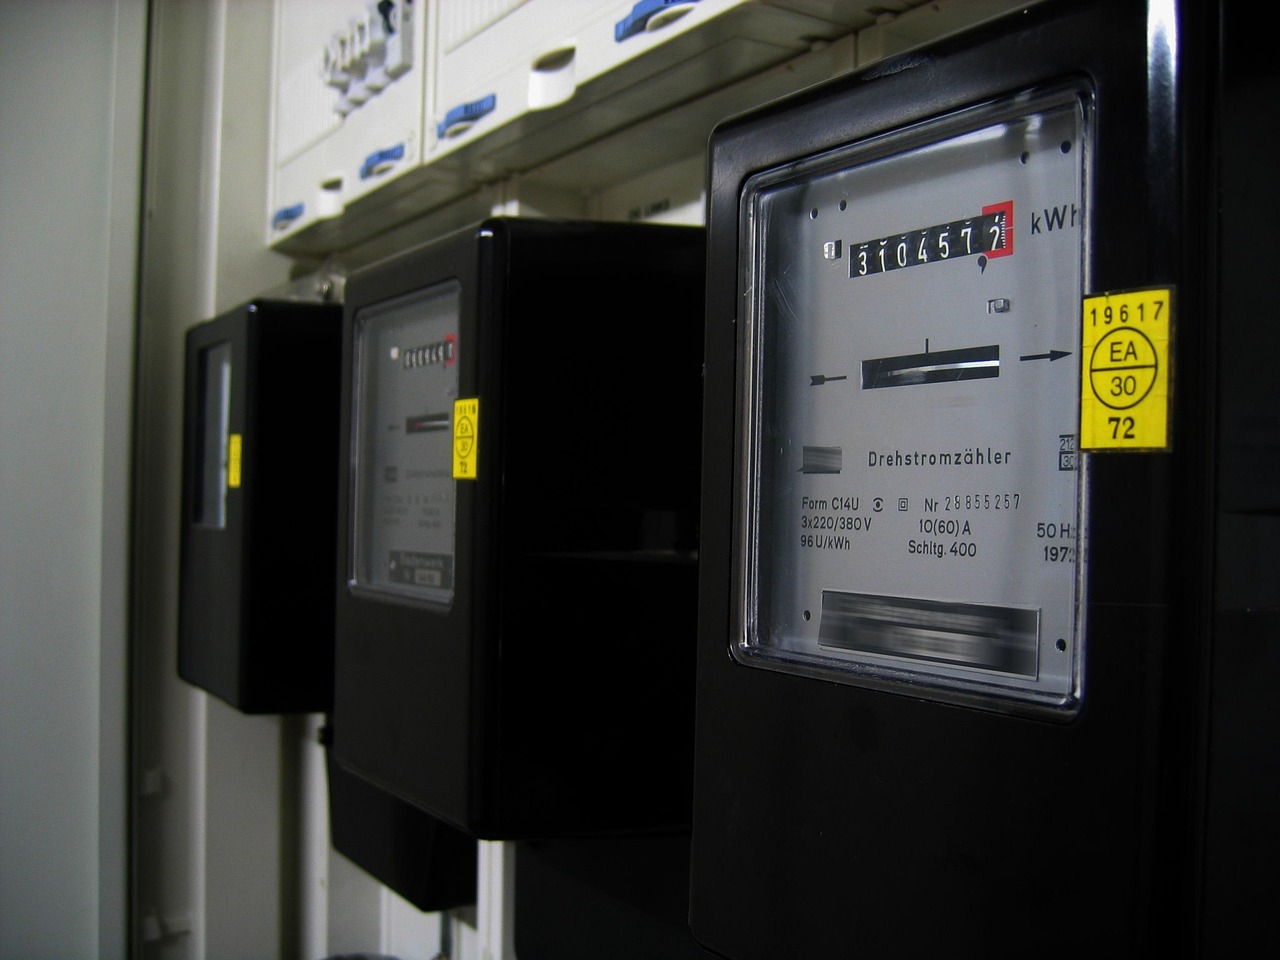
1. The Evolution of Solar Billing: From NEM 1.0 to Net Billing
To understand current utility tariff structures, it helps to examine how net metering policy originally worked and why state regulatory bodies are modifying it across the nation.
Traditional Net Metering (NEM 1.0 and 2.0)
Under original net metering rules, electric meters ran backward when solar panels produced excess power. If your system produced 30 kWh on a sunny Tuesday afternoon and your household used 10 kWh, the remaining 20 kWh were exported to the local distribution grid. The utility credited your account for those 20 kWh at the retail rate—say, 18 cents per kWh—yielding a $3.60 bill credit applied directly against electricity bought from the grid later that night.
As residential solar adoption grew exponentially, utilities argued that full 1:1 net metering allowed rooftop solar customers to avoid contributing to fixed grid maintenance costs, including poles, wires, transformers, and standby generating capacity. Under full retail net metering, solar customers lowered their overall volumetric energy payments, while non-solar customers effectively absorbed a higher proportion of grid infrastructure upkeep costs. Solar advocates and environmental groups countered that rooftop solar delivers local grid benefits, reduces transmission losses, and offsets expensive wholesale power purchases during hot summer afternoons.
The Rise of Net Billing and Avoided-Cost Rates
To resolve this debate, utility commissions in major solar markets—including California, Hawaii, Arizona, Nevada, Indiana, and parts of the Southeast—have systematically shifted away from full retail net metering toward net billing frameworks.
Under a net billing model, energy bought from the utility and energy exported to the grid are treated as two separate financial transactions, measured instantaneously down to 15-minute or hourly increments:
- Imported Electricity: You pay the standard, full retail utility rate for every single kWh your home draws from the grid.
- Exported Electricity: You are credited for excess kWh pushed back onto the grid at an “export rate,” which is frequently tied to the utility’s wholesale avoided cost—the price the utility would have paid to generate or purchase that power from a utility-scale power plant.
Because wholesale avoided costs typically range between 2 and 8 cents per kWh, while retail residential rates often sit between 12 and 35+ cents per kWh, this structural pivot substantially reduces the financial value of mid-day solar exports.
2. Examining Major Utility Tariff Transitions: The NEM 3.0 Blueprint
California’s transition from NEM 2.0 to its Net Billing Tariff (commonly called NEM 3.0) in April 2023 offers a clear case study in how modern solar tariff restructuring operates in practice. While each state maintains independent authority over utility regulations, California’s policy shift serves as an influential template for public utility commissions nationwide considering updates to grid rules.
| Metric / Feature | Traditional Net Metering (NEM 1.0 / 2.0) | Modern Net Billing (e.g., NEM 3.0 / Export Reductions) |
|---|---|---|
| Export Credit Value | Full Retail Rate (~$0.20 to $0.40+/kWh) | Avoided Energy Cost (~$0.05 to $0.08/kWh average) |
| Compensation Basis | 1:1 Energy Offset (kWh out = kWh in) | Instantaneous or Hourly Financial Offsets |
| Time-of-Use Sensitivity | Moderate; daytime credits match daytime rates | Extreme; credits vary dramatically by hour and month |
| Solar-Only Payback Period | 4 to 7 years (varies by region) | 8 to 14+ years without home energy storage |
| Battery Storage Incentive | Low; grid acts as a free battery | High; storing energy yields maximum financial value |
Under California’s net billing tariff, the value of exported solar energy declined by an average of 75% compared to prior rates. Rather than receiving fixed retail rates, exports are priced based on an Avoided Cost Calculator (ACC), which recalculates values for every hour of the year based on grid supply and demand.
During hot summer evenings when grid demand spikes, exported solar power (if backed by a home battery) can earn substantial credits per kWh. Conversely, during sunny April afternoons when regional solar production peaks, exported power may be credited at less than 3 cents per kWh. Utility commissions in states like Idaho, North Carolina, and Florida have similarly reviewed or instituted step-downs in export compensation, underscoring a national movement away from unadjusted 1:1 net metering.
3. How Export Rate Reductions Affect Solar Payback Timelines
When utility export rates drop, the financial metrics used to evaluate a rooftop solar investment change completely. System performance is no longer governed solely by total annual kWh production; it depends heavily on when electricity is generated, consumed, or exported.
Understanding Self-Consumption vs. Export Ratio
To quantify the real financial effect on your monthly electric bill, consider a standard 8 kW residential solar installation producing 11,000 kWh annually for a home that consumes 11,000 kWh per year.
In a typical home without battery storage, approximately 30% to 40% of solar generation is consumed directly by home appliances as it is generated (direct self-consumption). The remaining 60% to 70% is exported to the grid because rooftop panels produce peak power around mid-day when household power usage is often low.
Here is how the financial math breaks down under two contrasting utility rate policies for that exported 60% (assume 6,600 kWh exported per year, with a retail utility import rate of $0.22/kWh):
- Under Traditional 1:1 Net Metering: The exported 6,600 kWh yields $1,452 in bill credits ($0.22 × 6,600 kWh), offsetting evening grid power usage almost completely.
- Under an Avoided-Cost Export Rate ($0.06/kWh): The exact same 6,600 kWh yields only $396 in bill credits ($0.06 × 6,600 kWh).
The resulting difference is an annual cash flow reduction of $1,056 for the exact same physical solar hardware. Over a 20-year system lifespan, that shift amounts to over $21,000 in lost credit potential if household consumption patterns remain unchanged.
Recalculating System Payback
Before major export rate modifications, a solar installation in a state with moderate-to-high electricity prices often paid for itself within 5 to 7 years. Following transition to avoided-cost export structures, the payback timeline for a solar-only system can extend to 9 to 14 years depending on local retail power rates, system installation costs, and available federal or state tax credits.

4. Time-of-Use (TOU) Rates and Mandatory Rate Schedules
Export rate changes rarely occur in isolation. State utility commissions frequently require residential solar customers to transition onto mandatory Time-of-Use (TOU) rate schedules as a condition of interconnecting panels to the electrical grid.
How TOU Windows Impact Solar Economics
Under TOU schedules, the cost of electricity varies based on the time of day, day of the week, and season. Utility peak periods have largely shifted away from middle-of-the-day hours (11:00 AM to 3:00 PM) to late afternoon and evening hours (4:00 PM to 9:00 PM).
This structural schedule presents two operational challenges for solar owners:
- Low Production During Peak Rates: Rooftop panels generate power during off-peak or super-off-peak daytime hours when utility electricity rates are lowest. By 5:00 PM or 6:00 PM, when expensive peak rates begin, solar production drops as the sun sets.
- High Costs for Evening Imports: Power consumed in the evening must be purchased from the grid at elevated peak rates, while mid-day solar exports accrue credits at lower off-peak or avoided-cost values.
Without strategy adjustments, solar systems operating under mandatory TOU schedules can face higher monthly net charges than anticipated, even during peak summer production months.
5. The Shift to Solar-Plus-Storage: Battery ROI Dynamics
As export values decline, energy storage transitions from an optional emergency backup feature into an economic tool for protecting solar investment returns.
The Concept of Solar Arbitrage and Load Shifting
When utilities offer low export rates, selling excess solar energy back to the grid becomes unappealing. Home energy storage alters this equation through direct self-consumption optimization and load shifting:
- Step 1 (Daytime Capture): During sunny hours, excess solar generation charges the home battery instead of exporting to the grid at low avoided-cost rates ($0.05–$0.07/kWh).
- Step 2 (Peak Consumption Offset): During late afternoon and evening peak hours (4:00 PM to 9:00 PM), the battery discharges to power the home, avoiding expensive retail energy imports ($0.25–$0.45+/kWh).
By capturing power that would otherwise earn a low export credit and using it to avoid high retail import charges, the battery retains the full retail value of each generated kilowatt-hour. This practice effectively restores much of the utility bill savings formerly provided by traditional net metering.
Evaluating Battery Storage Economics
While home lithium-iron-phosphate (LFP) battery systems add initial capital expenses—typically $8,000 to $14,000 installed before incentives—their ROI profile improves as the spread between utility retail rates and export rates widens.
In markets with high peak retail rates and low export credits, adding a battery can lower overall payback periods for the combined solar-plus-storage installation compared to a solar-only setup operating under modern net billing tariffs. Additionally, residential battery systems remain eligible for the 30% Federal Investment Tax Credit (ITC) under Section 25D, reducing the net out-of-pocket capital expenditure.
6. Grandfathering Clauses: Protecting Existing Solar Installations
One critical aspect of utility regulatory decisions is the concept of legacy protections, commonly referred to as grandfathering clauses.
How Grandfathering Terms Work
When public utility commissions vote to lower export rates, they typically establish explicit transitional policies for existing system owners. Customers who submitted complete interconnection applications prior to established utility deadlines often retain their original net metering rate structure for a specified period (frequently 10 to 20 years from the date of original system activation).
Actions That Can Invalidate Grandfathered Status
Existing solar owners must take care not to inadvertently forfeit legacy net metering protections. In many utility service territories, specific system modifications can trigger an automatic re-evaluation of your interconnection agreement, pushing the entire home onto current net billing tariffs:
- Expanding System Capacity: Adding panels that increase system capacity beyond utility-defined thresholds (often a 10% or 1 kW increase) frequently voids legacy contracts.
- Substantial System Modifications: Inverter replacements or major wiring redesigns may require updated interconnection permits, depending on local utility rule interpretations.
- Property Sales and Ownership Transfers: While legacy rates usually transfer to new homebuyers upon property sale, some utility territories require contract re-execution that terminates grandfathering terms.
Action Step: Prior to expanding an existing solar system, review your utility’s official tariff sheets or consult your installer to confirm whether system modifications will alter your current tariff status.
7. How to Audit Your Utility Bill for Export Rate Changes
Utility bill layout changes can make it challenging to track how exported solar power is being credited. Performing a structured monthly audit helps verify that credits are being calculated accurately according to your active interconnection agreement.
Step-By-Step Monthly Audit Process
Follow this practical process to track your solar energy valuation:
- Identify Your Assigned Rate Schedule: Locate the service category on your electric bill (e.g., “Schedule NEM-2,” “Residential Net Billing,” or “TOU-EV-1”). Confirm that this matches your approved interconnection documentation.
- Separate Import and Export Line Items: Under net billing, your bill should distinguish between total energy drawn from the grid (Imports) and total power sent back (Exports). Ensure these values align closely with reading history from your solar inverter monitoring app.
- Calculate the Effective Credit Rate: Divide the total dollar credit applied for exported energy by the total exported kWh during that billing cycle. If your total export credit is $24.00 for 400 exported kWh, your effective export compensation rate was $0.06 per kWh.
- Track True-Up or Annual Settlement Dates: Most utilities operate on an annual settlement cycle (a “True-Up” statement). Review whether accrued credits roll over month-to-month to offset future electric charges, or if unused credits are paid out annually at a lower wholesale cash-out rate.
8. Tactical Adjustments to Maximize Solar Value Under New Export Rules
If your utility operates under reduced export valuation or net billing schedules, adjustments to home energy habits can improve system financial returns without purchasing additional hardware.
Maximize Daytime Direct Consumption
Every kilowatt-hour of solar power consumed directly inside your home offsets a full-price retail kWh purchase. Shift electrical loads into daylight hours between 10:00 AM and 3:00 PM:
- Program heat-pump water heaters to execute high-temperature heating cycles during mid-day hours.
- Schedule dishwashers, clothes dryers, and pool filtration pumps to operate sequentially during peak solar generation windows.
- Pre-cool or pre-heat your home during mid-day hours using smart thermostats, reducing HVAC electrical demand during expensive late-afternoon peak utility windows.
Optimize Electric Vehicle (EV) Charging
Electric vehicles represent substantial electrical loads that can be scheduled strategically. Avoid charging EVs overnight using grid power if your daytime solar generation is exported for low credits. Instead, use Level 2 smart EV chargers set to “solar capture mode”—adjusting charge power dynamically to match real-time excess solar production.
9. Practical Real-World Scenarios: Comparing Household Outcomes
To see how these concepts function in practice, let’s examine three representative scenarios involving modern tariff environments across typical American households.
Scenario A: The Unadapted Solar-Only Household
Mark and Sarah installed an 8 kW solar-only system in a state that recently transitioned to an avoided-cost export rate ($0.06/kWh) paired with a TOU rate ($0.38/kWh peak from 4:00 PM to 9:00 PM, $0.18/kWh off-peak). Both work away from home during the day. Their panels generate 35 kWh on a sunny July day, exporting 25 kWh to the grid while they are away and self-consuming only 10 kWh. At night, they return home and consume 20 kWh during peak rates.
- Export Credits Earned: 25 kWh exported × $0.06 = $1.50 credit.
- Evening Power Costs: 20 kWh imported × $0.38 = $7.60 charge.
- Net Daily Energy Balance: A net cost of $6.10, despite producing 35 kWh and only consuming 30 kWh overall.
Because their excess generation was sold cheaply and their evening consumption was purchased at peak rates, their bill remains surprisingly high despite positive net energy generation.
Scenario B: The Load-Shifted Solar Household
Using the exact same solar installation and utility rate structure, Mark and Sarah install smart timers and adjust their household habits. They run their dishwasher, laundry, and water heater between 11:00 AM and 2:00 PM. They also pre-cool their home to 68°F at noon and let the thermostat rise to 76°F between 4:00 PM and 9:00 PM.
- Daytime Direct Self-Consumption: Increases from 10 kWh to 22 kWh.
- Exports Reduced: Drops to 13 kWh exported × $0.06 = $0.78 credit.
- Evening Peak Imports Reduced: Drops to 8 kWh imported × $0.38 = $3.04 charge.
- Net Daily Energy Balance: A net cost of $2.26—saving $3.84 daily ($115 per month) compared to Scenario A with zero additional hardware spend.
Scenario C: The Solar-Plus-Storage Household
Under the same tariff, the household adds a 10 kWh battery storage system. The battery captures the 25 kWh of daytime excess production (filling the 10 kWh usable capacity completely). During the 4:00 PM to 9:00 PM peak window, the home runs entirely off the battery, discharging 10 kWh to power lighting, cooling, and electronics.
- Daytime Exports: Remaining 15 kWh exported × $0.06 = $0.90 credit.
- Evening Peak Imports: Reduced to 10 kWh imported × $0.38 = $3.80 charge (or zero imports if conservation is maintained).
- Net Daily Energy Balance: Financial performance improves significantly, maximizing long-term protection against utility rate escalation.
10. Common Pitfalls to Avoid with Modern Utility Rates
Navigating modern solar export rules requires avoiding several widespread financial and operational traps:
- Over-Sizing Solar Systems Without Storage: Under traditional net metering, sizing a solar array to cover 110% or 120% of annual electric needs made financial sense because extra credits offset fixed charges. Under net billing, over-sizing a solar-only system generates massive mid-day exports that yield negligible wholesale credits, worsening overall system ROI.
- Assuming Inverter Upgrades Won’t Affect Grandfathering: Replacing a broken inverter with a significantly larger model or converting to a microinverter architecture without checking local utility rules can accidentally trigger an interconnection agreement rewrite, forfeiting legacy NEM 1.0 or 2.0 status.
- Ignoring Fixed Customer Charges: Many utility commissions approving export reductions simultaneously increase monthly fixed grid access charges (e.g., $15–$30/month) that cannot be offset by solar credits. Factor these un-offsettable fixed costs into your financial forecasts.
- Failing to Program Smart Home Devices: Installing smart thermostats, heat pump controllers, or EV chargers without configuring them specifically to match solar production windows leaves easy operational savings on the table.
11. Key Questions to Ask Before Solar Installation Today
If you are planning a new rooftop solar installation under current utility policies, ask potential installers these targeted technical questions to ensure your prospective financial projections are grounded in accurate utility math:
- Which exact utility tariff schedule was used in your financial savings model? Ensure the proposal reflects your utility’s current post-NEM tariff rather than historical net metering rates.
- What explicit export credit value ($/kWh) is applied in your payback projections? Watch out for proposals that assume 1:1 retail credit rates in regions that have transitioned to avoided-cost compensation.
- What percentage of annual generation is assumed to be self-consumed versus exported? Realistic models for homes without storage generally cap direct self-consumption at 30% to 40%.
- How does adding energy storage affect system payback under local export rates? Request a side-by-side financial comparison showing a solar-only system versus a paired solar-plus-storage installation.
- Does your software model hourly Avoided Cost Calculator (ACC) export curves? Confirm that savings estimates account for seasonal and hourly fluctuations in export valuations rather than a flat annual average.
Navigating Future Utility Export Rules
As state energy policies evolve and electric grid integration requires balanced power distribution, rooftop solar economics will continue shifting toward self-consumption and battery integration. While traditional 1:1 net energy metering is becoming less common across major US utility markets, rooftop solar remains a practical tool for lowering long-term electricity costs when installed with accurate tariff assumptions.
By monitoring your utility’s regulatory decisions, reviewing your monthly billing statements, and aligning household electricity consumption with solar production cycles, you can protect your financial investment and maintain reliable home energy independence regardless of policy updates.